KAI Commuter Manggarai Boarding
2025 — A simulation of the chance to catch a train at Manggarai
01 Problem
A commuter wants to catch a KRL Commuter Line train at Manggarai, one of the busiest stations in Jakarta. The train leaves Depok on a timetable it does not always keep, and the commuter does not reach the platform at the same minute every day either.
The goal is the probability that the commuter is on the platform by the time the train arrives, and how that probability splits between days the commuter is on time and days they are late.
02 Commuter
The commuter reaches the platform at 13:28, 13:30, 13:32, or 13:34, most often at 13:30. Reaching it by 13:30 counts as on time.
passenger_arr_times <- c(
  as.POSIXct("2025-01-01 13:28:00"),
  as.POSIXct("2025-01-01 13:30:00"),
  as.POSIXct("2025-01-01 13:32:00"),
  as.POSIXct("2025-01-01 13:34:00")
)
passenger_arr_probs <- c(0.30, 0.40, 0.20, 0.10)
03 Train
The train leaves Depok at 13:00 on 70% of days, at 13:05 on 20%, and at 13:10 on 10%. The trip to Manggarai then takes anywhere from 28 to 32 minutes, with every duration in between equally likely.
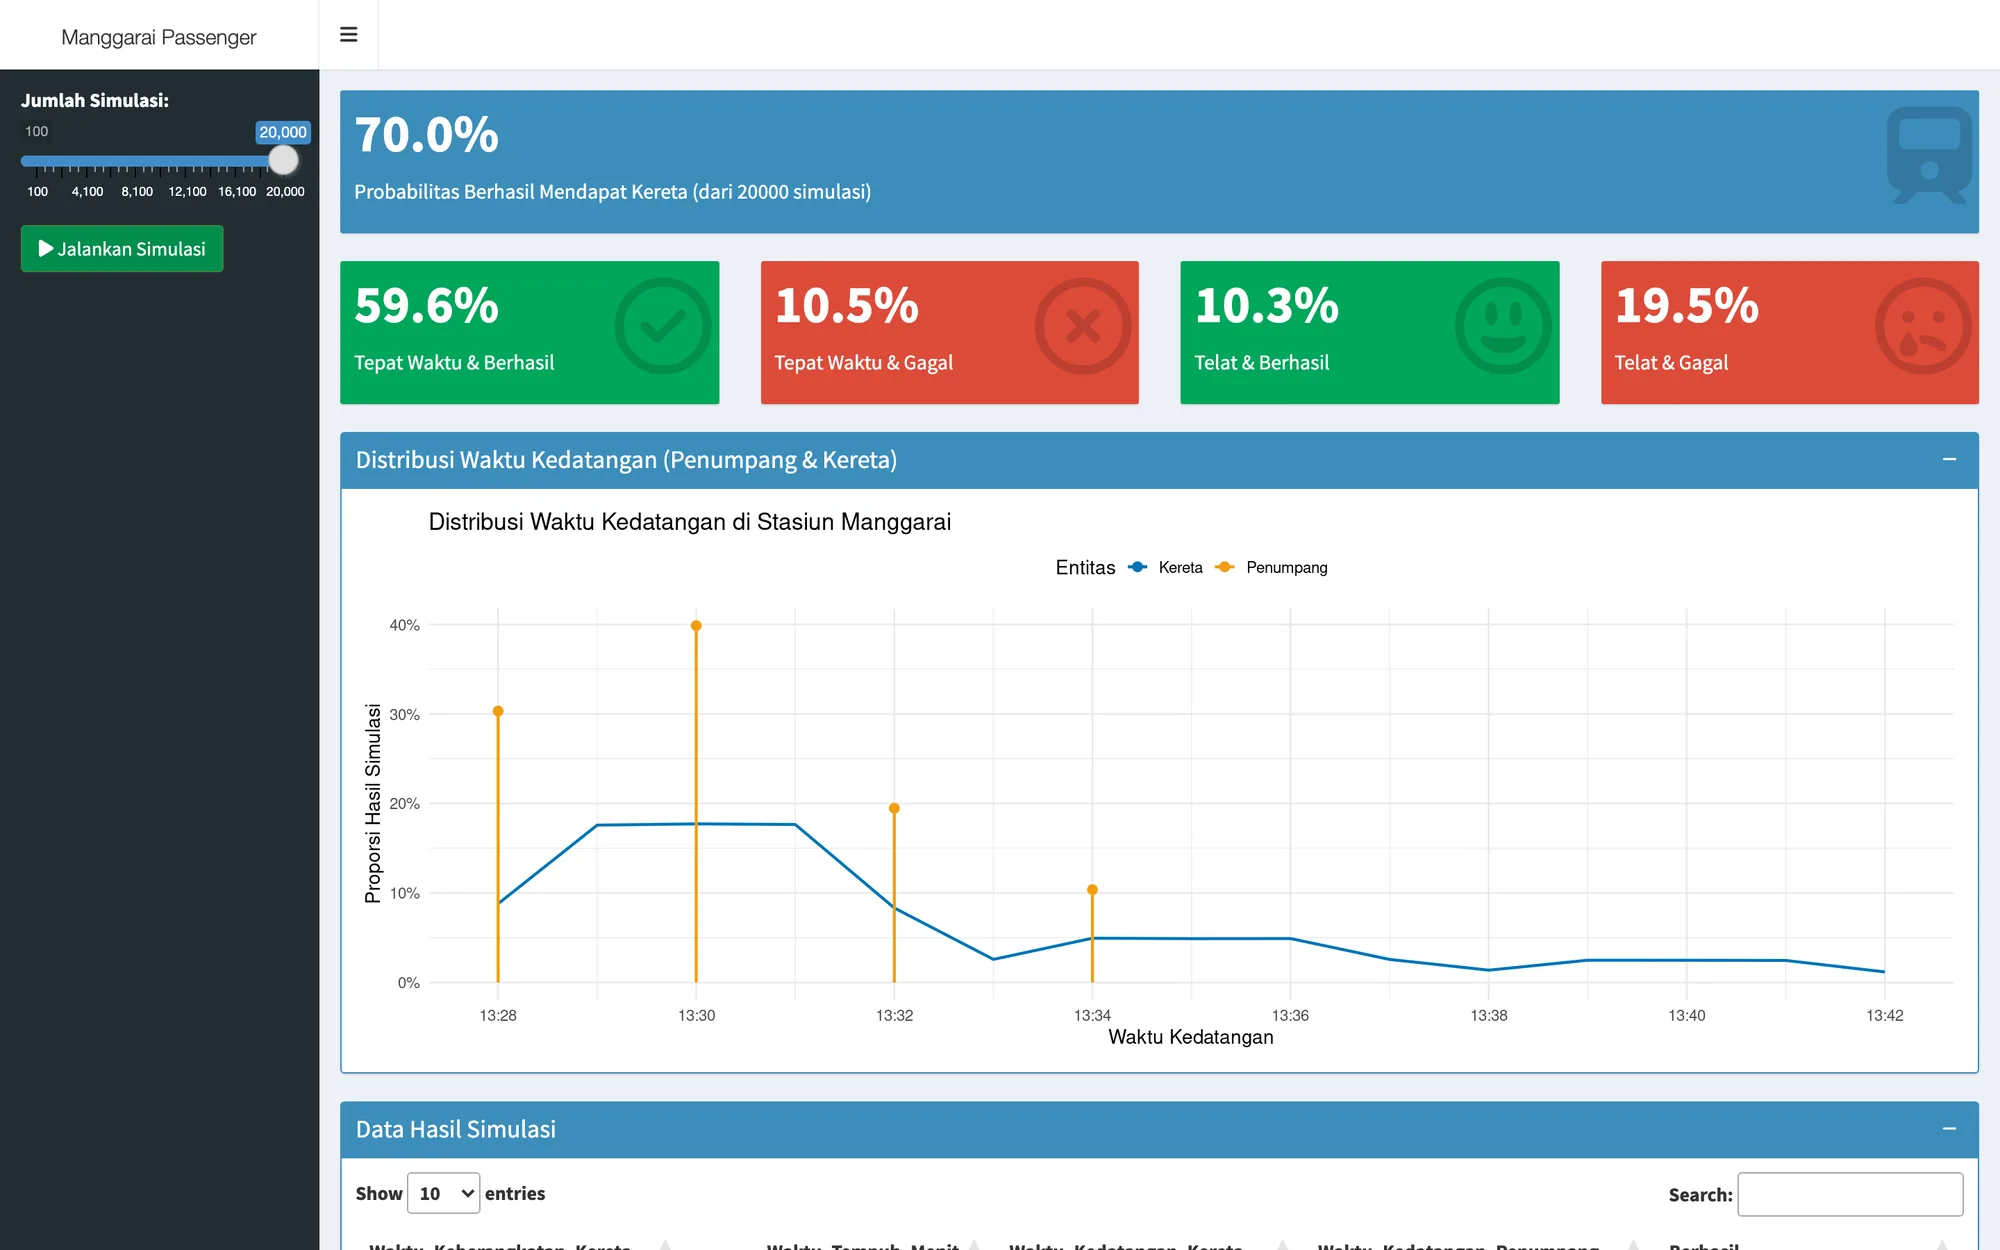
Together they put most arrivals between 13:28 and 13:32, with a long tail to 13:42 from the late departures.
train_dep_times <- c(
  as.POSIXct("2025-01-01 13:00:00"),
  as.POSIXct("2025-01-01 13:05:00"),
  as.POSIXct("2025-01-01 13:10:00")
)
train_dep_probs <- c(0.70, 0.20, 0.10)

travel_duration_minutes <- runif(1, 28, 32)
04 Simulation
Each run draws one departure, one travel time, and one commuter arrival, and counts as boarded when the commuter reaches the platform no later than the train. The train does not wait.
The run is repeated 20,000 times, the most the original app allows, and the share of boarded runs estimates the probability.
run_single_simulation <- function() {
  train_departure_time <- sample(train_dep_times, 1, prob = train_dep_probs)
  travel_duration_minutes <- runif(1, 28, 32)
  train_arrival_time <- train_departure_time + minutes(round(travel_duration_minutes))
  passenger_arrival_time <- sample(passenger_arr_times, 1, prob = passenger_arr_probs)
  success <- passenger_arrival_time <= train_arrival_time

  return(data.frame(
    Waktu_Keberangkatan_Kereta = train_departure_time,
    Waktu_Tempuh_Menit = round(travel_duration_minutes, 1),
    Waktu_Kedatangan_Kereta = train_arrival_time,
    Waktu_Kedatangan_Penumpang = passenger_arrival_time,
    Berhasil = success
  ))
}

results_df <- bind_rows(replicate(input$n_simulations, run_single_simulation(), simplify = FALSE))
probability <- sum(results_df$Berhasil) / nrow(results_df)
05 Exact answer
The chance the simulation estimates can also be worked out exactly. Count minutes after 13:00. The train leaves Depok at minute , takes minutes to Manggarai, and the commuter reaches the platform at minute . The commuter boards when , and since the three are drawn independently, the chance of boarding is a sum over every departure and arrival of their two chances times the chance that the trip is long enough.
The app rounds the trip to a whole minute, so 29, 30, and 31 minutes each take a quarter of the four-minute range, while 28 and 32 take only the half minute on their inner side, an eighth each. A train leaving at 13:00 always picks up a commuter who arrives at 13:28. It picks up one who arrives at 13:30 five times in eight, when the trip rounds to 30 minutes or more, and one who arrives at 13:32 only after a 32-minute trip. It never picks up one who arrives at 13:34.
A train leaving at 13:05 reaches Manggarai at 13:33 or later and misses only a commuter who arrives at 13:34 after a 28-minute trip. One leaving at 13:10 arrives at 13:38 at the earliest and never misses. Weighting the three departures by how often they happen gives exactly 70.0%.
06 Answer
The commuter boards in 70.5% of the 20,000 runs. The running share swings widely over the first few hundred runs and settles as more are added.
It ends 0.54 points above the exact 70.0%. A share of runs strays from the true chance by about one standard error, 0.32 points at 20,000 runs, so the gap is 1.7 standard errors, the kind of miss one batch of runs makes by chance.
07 Scenarios
Split by when the commuter arrives, 59.6% of runs are on time and boarded, and 10.4% are on time but missed. Every such miss is a commuter reaching the platform at 13:30 just after a train that left at 13:00 and arrived at 13:28 or 13:29, which happens on exactly 10.5% of days.
Late commuters still board in 10.9% of runs, saved by a late train, and miss the train in 19.1%. Being late happens on 30% of days but causes 65% of the misses.
on_time_threshold <- as.POSIXct("2025-01-01 13:30:00")

categorized_df <- results_df %>%
  mutate(
    penumpang_tepat_waktu = Waktu_Kedatangan_Penumpang <= on_time_threshold,
    skenario = case_when(
      penumpang_tepat_waktu & Berhasil  ~ "on_time_success",
      penumpang_tepat_waktu & !Berhasil ~ "on_time_fail",
      !penumpang_tepat_waktu & Berhasil ~ "late_success",
      !penumpang_tepat_waktu & !Berhasil~ "late_fail"
    )
  )
08 Original app
The simulation was first built in R as an interactive Shiny dashboard. A slider sets the number of runs from 100 to 20,000, and each press of the run button redraws the overall probability, the four scenarios, the arrival distribution, and a filterable table of every run.
It is still live on shinyapps.io. The free tier puts the app to sleep when nobody is using it, so the first visit can take a while to load.
09 Limits
The model describes a trip of any length from 28 to 32 minutes, but the original app rounds it to a whole minute before adding it to the departure. That turns the half minute of trips just under 30 and 32 minutes after a 13:00 departure, and just under 29 after a 13:05 one, into ties at 13:30, 13:32, and 13:34 that count as boarded. Without rounding, the chance that the trip is long enough falls by an eighth in each of those three cases, and the exact answer drops to 64.5%.
The probabilities are assumptions, not measurements from KRL records, and the commuter and the train are assumed independent, with no time spent waiting at the platform. Real departure logs from Depok would make the answer worth trusting.
KAI Commuter Manggarai Boarding
Catches the train in 70.5% of 20,000 simulated afternoons